So, Does Anyone Even Use All These Darn CPU Instructions?
That’s the question I found myself asking earlier this month when I was writing a simple compiler for an OCaml dialect called MinCaml. I don’t know if you’ve ever taken a look at the Intel IA32 instruction references, but there are two volumes of detailed descriptions of all the functions one of these CPU provides: about 600 in total!
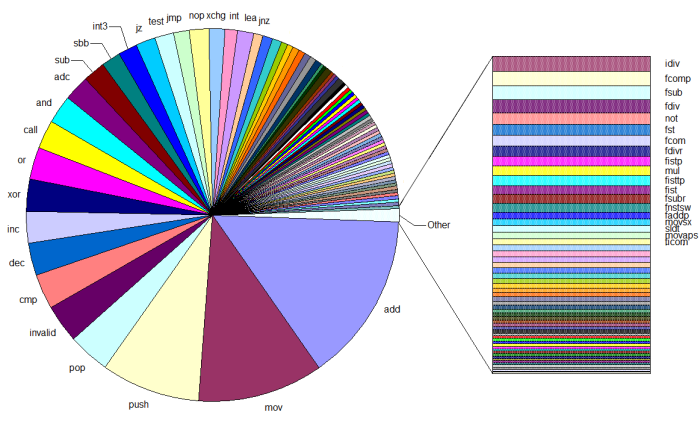
As this compiler backend was my first real go at writing out assembly (though I’d read quite a lot of it before) I found the task of potentially learning all these instructions extremely intimidating, and wished I had an assembly language “cheat sheet” where I could go to find out the most common (and hence probably the most useful) instructions. So, today I got around to writing a little program to use UDis86 to scan all the binaries in C:\Windows\System32 and my Cygwin /bin directory and spit out some instruction counts. Now, before we see the results let me first say that my sample has a bias in that it’s all precompiled stuff that will be designed to take advantage of only the lowest common denominator of the target CPU instruction sets. This means that the distribution below will probably be quite different than if you scan, say, your machine-specific Gentoo installation. Right, onto the big monstrous Excel pie chart:
I’ve also uploaded my raw data to my personal site, along with the program I used to get the results for anyone who is interested.
In the finest traditions of top 10 lists everywhere, let’s give a quick rundown of the most popular instructions:
-
add: is anyone really suprised by this?
-
mov: again, it’s fairly hard to get work done without moving data around
-
push/pop: these instructions are commonly used for setting up/destroying function stack frames, hence their popularity despite IA32s register orientation
-
invalid: do’h! These are from areas of code where udis86 just barfs :-). Their high ranking could mean a lot of instructions are in use that it can’t deal with, or (more likely) it is trying to disassemble executable regions of the binary that just don’t have anything useful in them
-
cmp: the absolute bedrock of branching on the IA32, but what is suprising is that it’s so much higher than jz. Are there really that many pure numeric comparisions in programs?
-
dec/inc: I’m fairly suprised that dec beats inc here, especially since sub is so much lower than add in my data: does anyone have a theory?
-
xor/or: xor no doubt clocks in so high because of the “xor reg, reg” idiom used to zero out registers, but or is quite popular too for something which is really only good for bit flags and the odd if expression…
Well that was fun, in a geeky sort of way! I’d be quite interested in knowing the reasons behind some of the oddities above: maybe another blog entry is in order…?
Edit: an experienced reverse engineer, t_w, commented on Reddit that my count for add was quite high, and that it might be caused by counting junk code. It turns out that the byte sequence 0x0000 disassembles to an add instruction, which skews my results since the null byte is common padding for executable .text sections. However, after correcting for this (the charts above have taken this into account) it still leaves add in first place (it had 83355055 counted occurances before excluding this sequence, but still 45303805 after exclusion).
For the dec part, maybe it's because dec is used for looping over indexes (loops from n to 0 and comparisons to 0 instead of looping from 0 to n and comparing the index to n, which I think is more expensive than comparing to 0)
Masklinn, I thought about that too, but since almost every loop I see in source code is 0 to N it seemed a bit unlikely. To swap the order of looping around, a compiler would have to do considerably work to preserve the semantics of the loop, negating any advantage from comparing to 0... but then I'm not an expert on compiler optimisations, by any means :)
The idea that comparing to zero is faster than comparing to nonzero is a fallacy, though there are a lot of people that believe it. I would venture to say that that is why, just people thinking it's faster to do a decrementing loop than an incrementing loop.
The compare itself against zero is not faster than comparing to a number, but to compare against a number, that number must be loaded into a register, but comparing to zero doesn't require zeroing a register, so it is faster overall.
You can compare against a raw number with out loading it into the register. I think it's 'immediate' in intel terminology?
Anyway, it'd be interesting to compare something compiled with msvc, gcc, and intel's optimizing compilers.
Pure unextended IA32 has so few registers that it might as well be a stack arch. :-)
IIRC, dec sets the zero flag automatically if the result is zero. If you do a jz (or jnz) in the loop afterwards you can save the extra comparison against a number.
So it's
dec cx
jnz loop
against
inc cx
cmp number
jb loop
Good thought Leo, that does make sense! Comparing with 0 might also be faster in the case where the compiler has dedicated a register to holding 0, which is a suprisingly common optimisation.
Is your program dealing with differing alignments, and finding the start of any given function or code-sequence within the .text section? Given that IA32 instructions are variable width, it's possible that scanning the same code sequence starting at offset 0 or offset 1 will see different instructions. Disassembly is only reliable if you can follow the symbols and branch instructions to find out where a given block of code really starts, and even then most automated tools need help to identify some functions and entry-points.
I wonder if your high percentage of invalid instructions might be a result of unpredictable offsets between code blocks, as well as the possible bogus bytes between them.
Nice job. I was also put off by the huge number of instructions on x86. I was wondering if anyone knows of a nice x86 instruction encoder? I.e. kinda like an assembler but you call functions to output the binary code instead of passing in a text file.
Google for "The New Jersey Machine-Code Toolkit". It contains a specification for x86 that can be used to build assemblers, disassemblers, code generators, tracers, profilers, and debuggers.
Statistics and charts are always interesting!
Nice stuff!
Fascinating article. It's a nice approach to the problem of "ok, what do I really need to know about this processor architecture?".
adc has a high count (higher than the jumps) which surprises me. The possible explanations I can think of are: 64-bit arithmetic (or bignums, etc); some compiler generated template that computes a result into the carry flag and then uses adc to copy the carry flag into a register; compiler observes that the carry flag is 0 and arbitrarily chooses adc over add.
I wouldn't expect dec to be so high either, perhaps it appears in the hand-coded and then inlined versions of memcpy, memset, etc?
I'm not surprised to see the huge disparity between push and pop in your chart, it's certainly the way I feel most software works these days. But I expect you'd get rather different results if you mapped the execution frequencies of instructions rather than just their static occurrences.
This is the BEST Computer's Coding ilustration !
thanks for your post
Best Regards...
ngadutrafik 2007
Years ago, I read some alternate codes...:
http://ruthless.zathras.de/fun/top-secret/NewOpCodes.txt
Such a list makes me wonder just how close to reality they were. :)
Well there is a lot of dupe opcodes, but optimized for the first register, ax.
.....
That's really interesting!
Considering that Intel and AMD are constantly adding instructions to their processors, I have always wondered if all those new and shiny SSE, SSE2, SSE999, etc. are really used by common software or if those parts of the chip stay idle most of time. Do you have any data about it? :-)
Actually the SSE is heavily used in Multimedia applications especially games. Also the latest MSVC compiler uses SSE (scalar) instructions for float operations. Data about this can only be obtained by getting dynamic analysis of applications.